12 debugging techniques in JetBrains Rider you should know about

Introduction:Nothing disrupts the flow of software development like a bug that breaks your app. Bugs are a normal part of software development, but that doesn’t mean you have to spend more time fixing them than you'd like.
Here are the 10 strategies for improving developer experience in enterprise organizations. From selecting the right languages and frameworks to fostering a culture of innovation, each strategy is designed to empower developers and optimize their workflow.
1. Inline Watches

Avoid adding extra variables for debugging by using JetBrains Rider's "Add Inline Watch" option to see evaluated results right in the editor.
2. Return Values
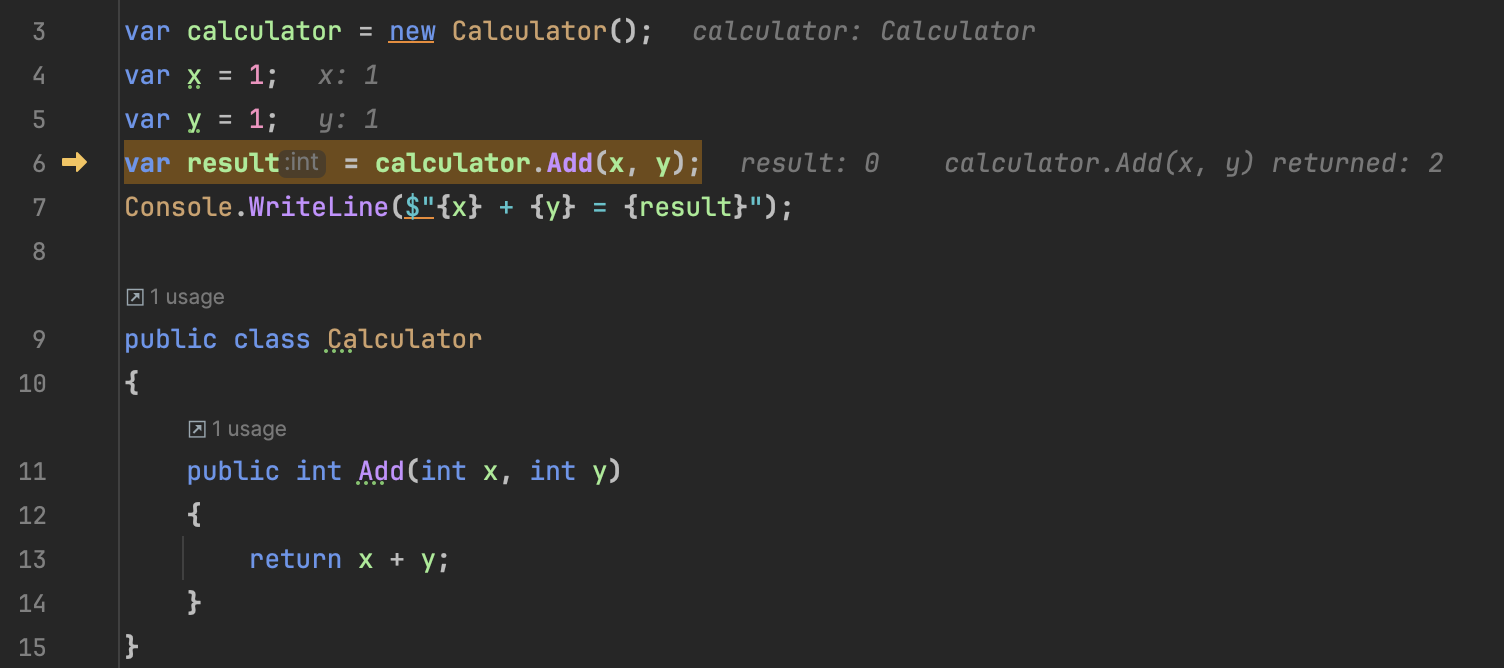
Inline watches also display return values automatically, providing additional insights during debugging.
3.Smart Step Into Debugging
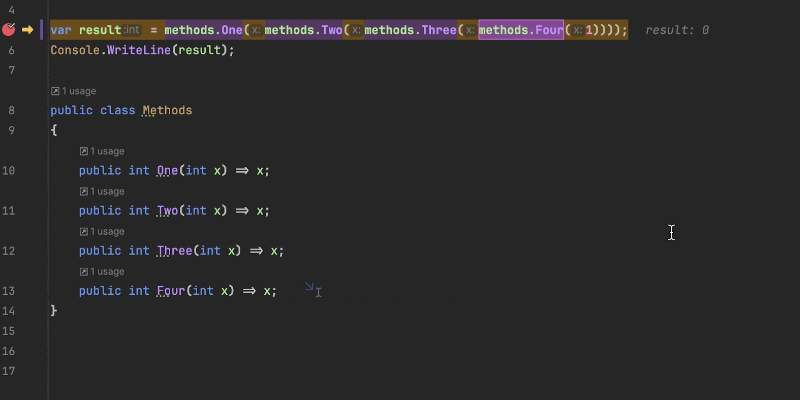
Use Smart Step-Into to navigate through method calls efficiently, choosing the correct method without navigating through irrelevant ones.
4. Breakpoints Options
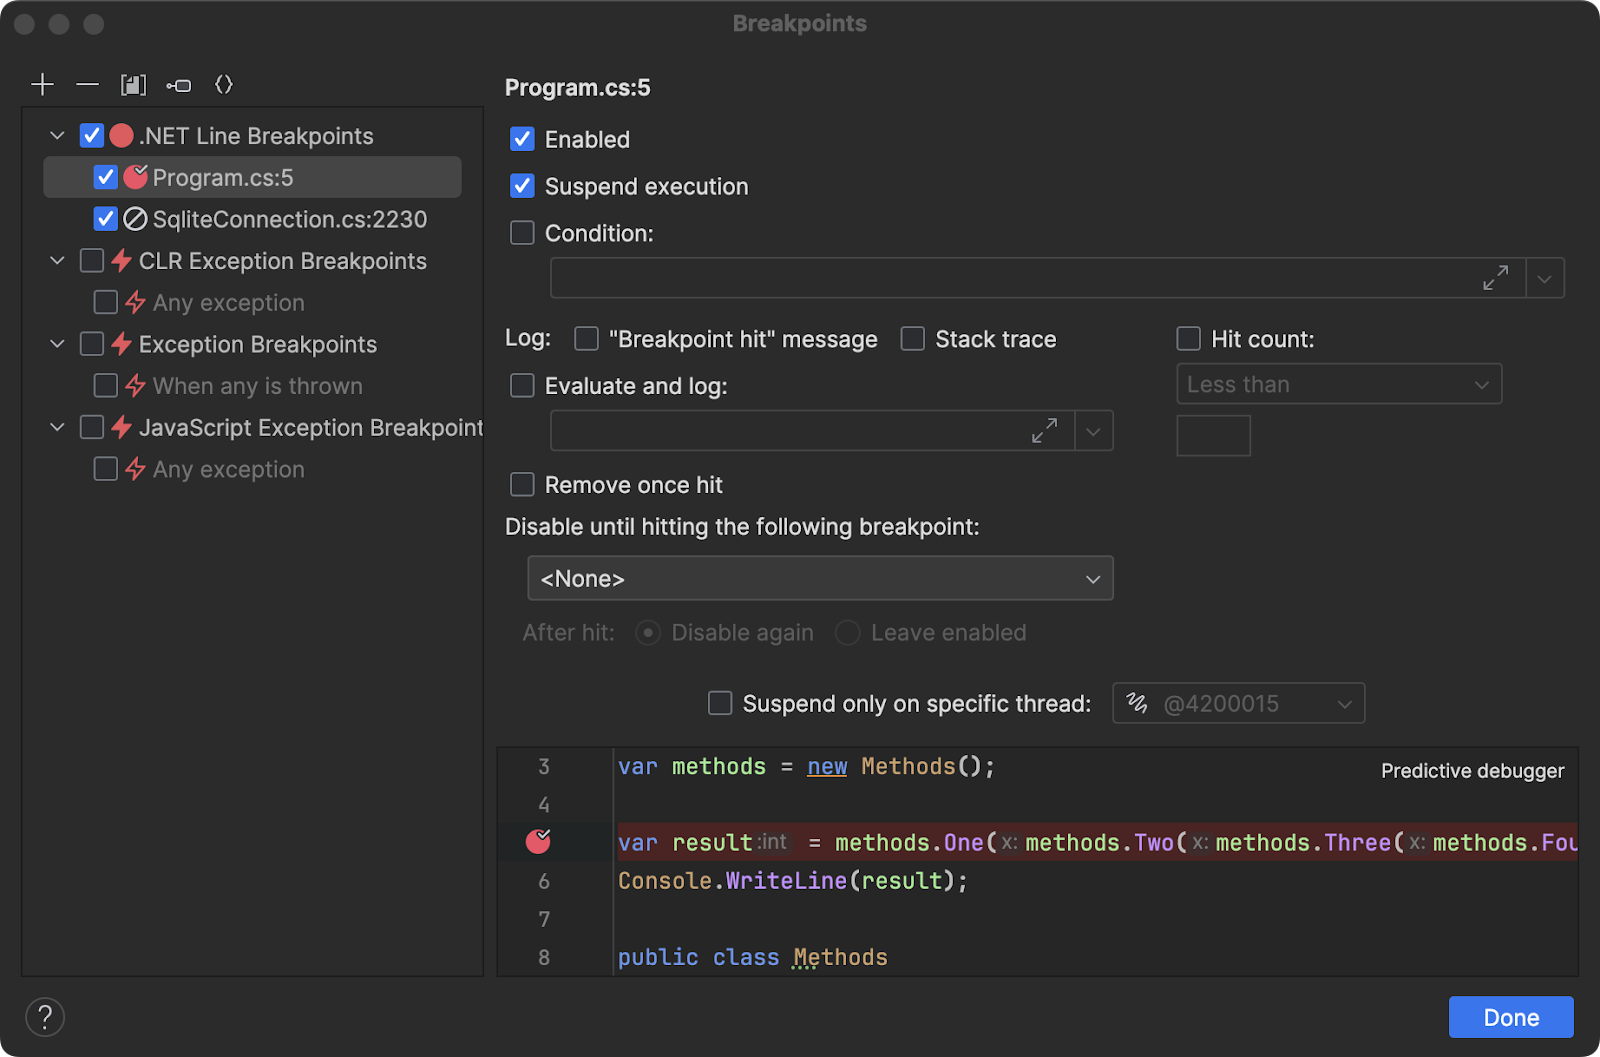
Customize breakpoints behavior using the Breakpoints options window, saving time and improving debugging efficiency.
5. Drag Execution Pointer
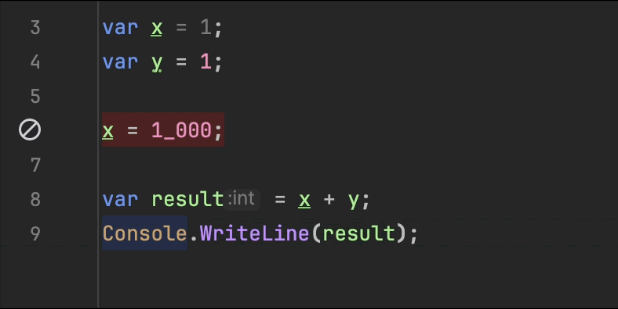
Alter the execution path of your running application by dragging the yellow execution point, helping narrow down issues quickly.
6. Debugging External Decompiled Code
Jump to code containing symbols even if they need decompiling, enabling debugging of third-party libraries.
7. Exception Breakpoints
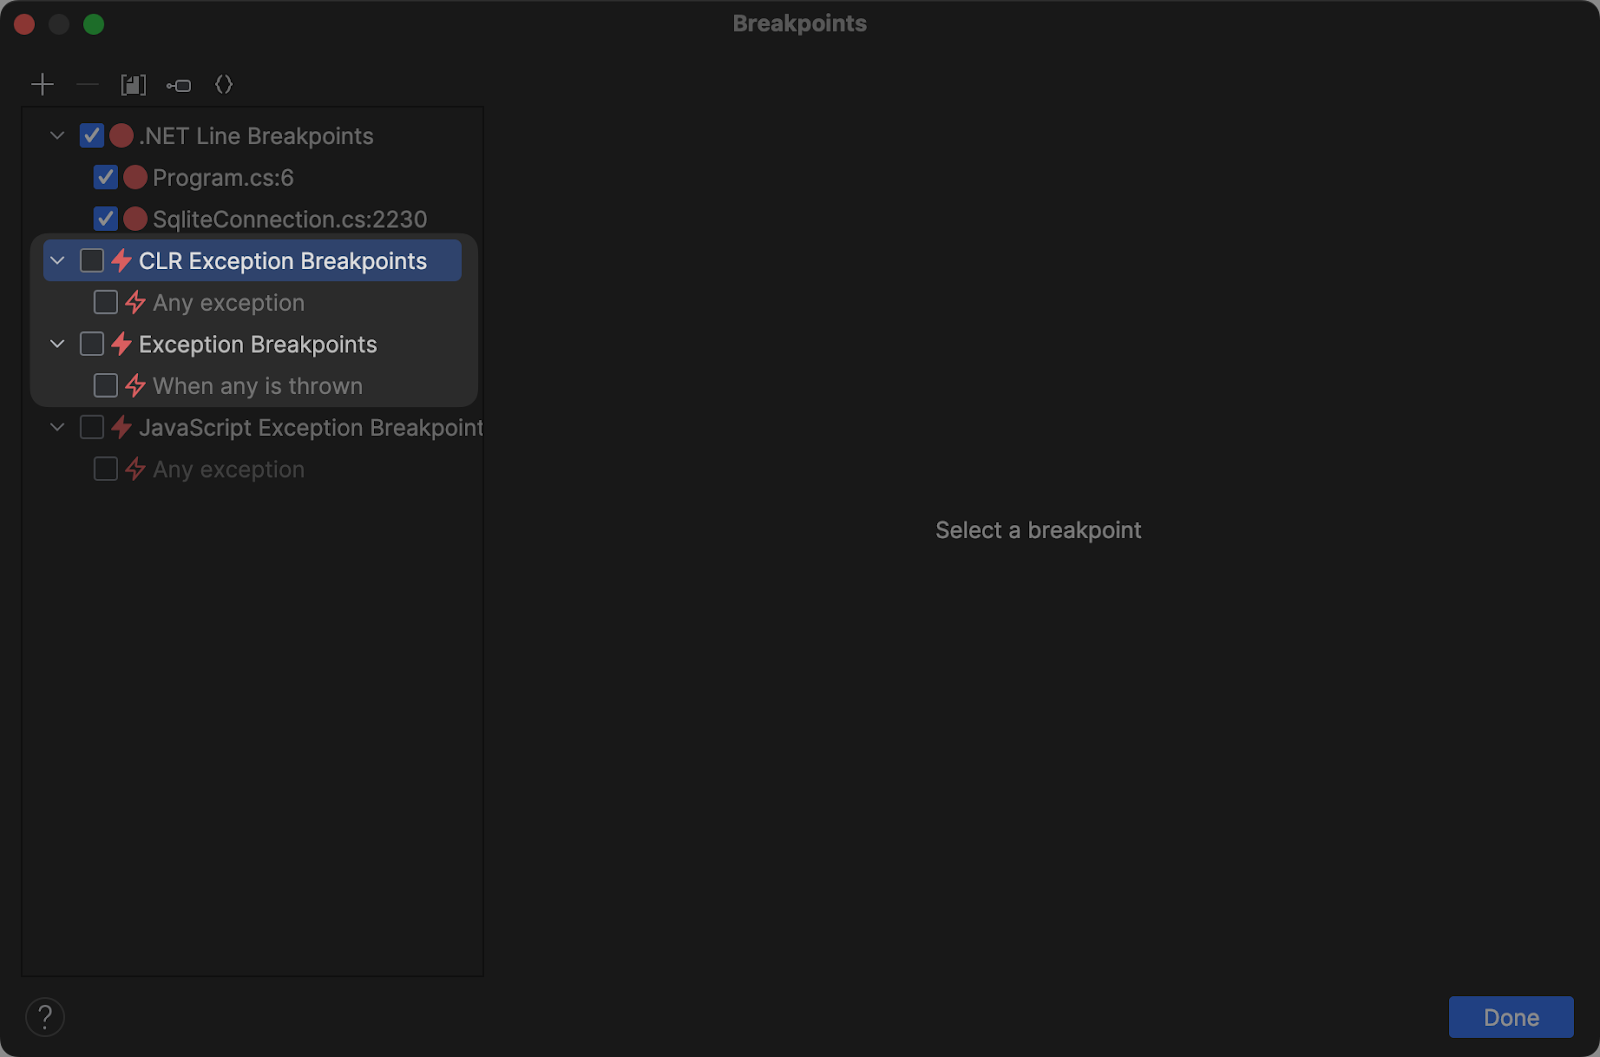
Set breakpoints for CLR or general exceptions to catch issues before they disrupt your debugging session.
8. Run and Debug Static Methods
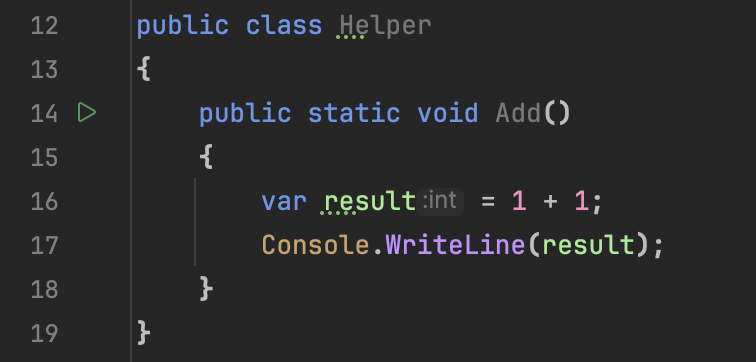
Run static methods in isolation to create self-contained debugging scenarios.
9. Edit and Continue
Make targeted code changes to a running application without recompiling or stopping your investigation using Edit and Continue.
10. Memory View
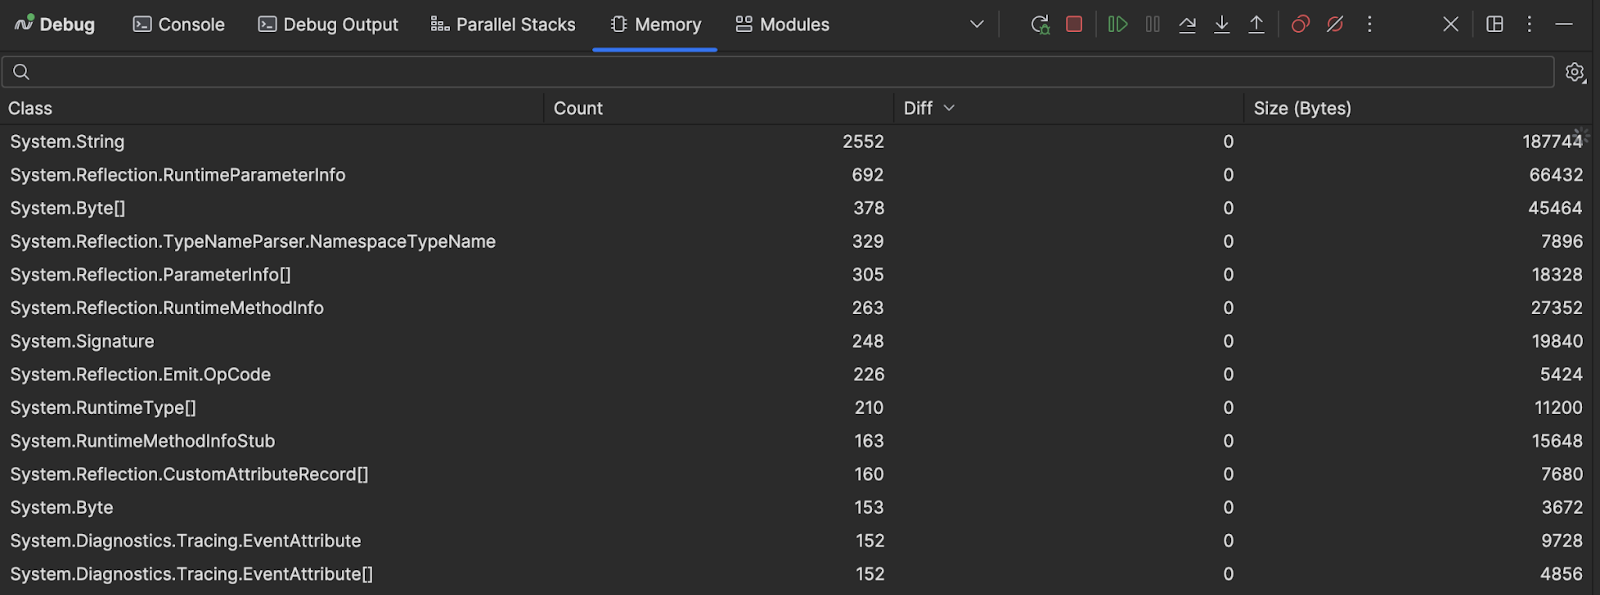
Get insights into your application's memory space using JetBrains Rider's Memory tab.
11. Thread Specific Breakpoints
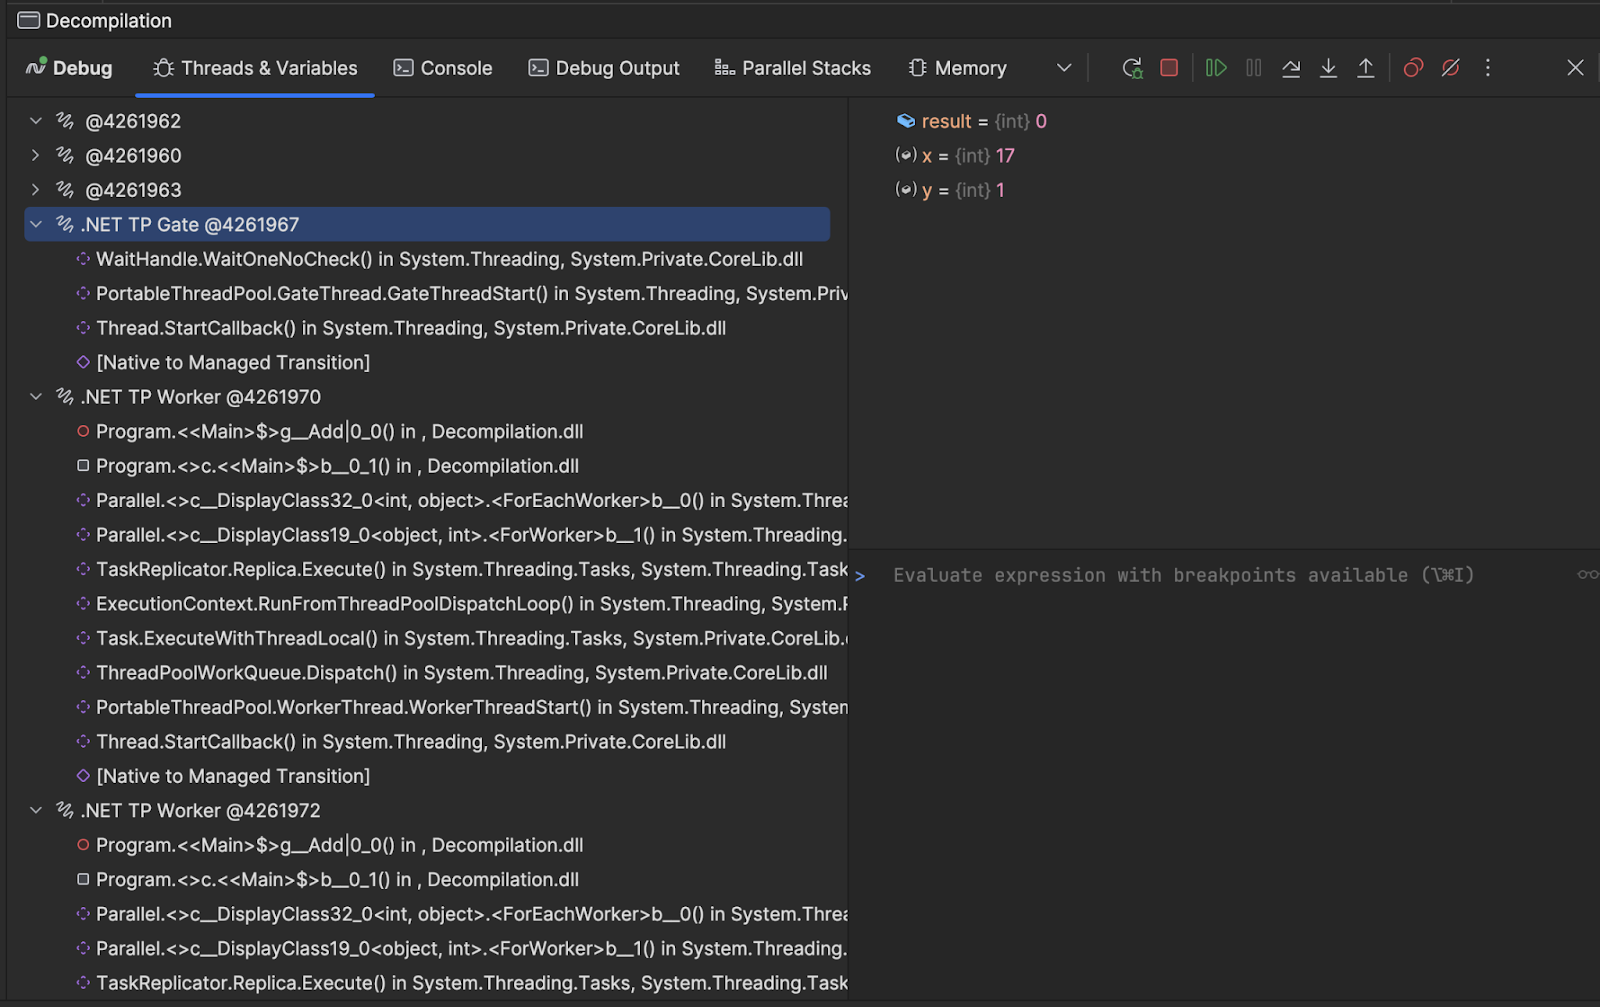
Set breakpoints specific to individual threads to focus debugging efforts.
12. DebuggerDisplayAttribute Support
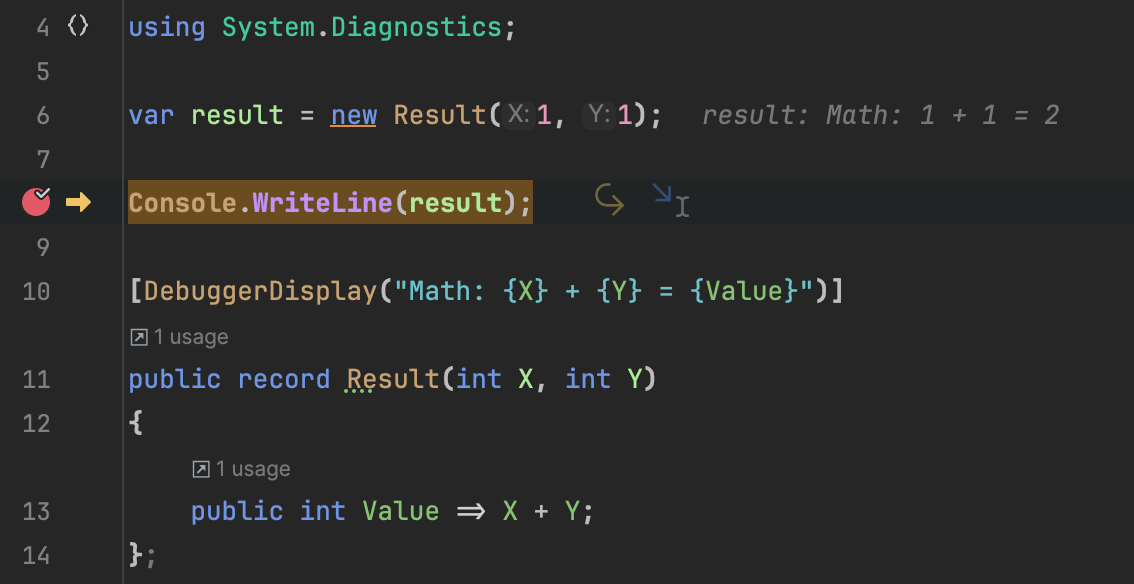
Use DebuggerDisplayAttribute to customize how critical information is displayed in JetBrains Rider.
Bonus: Predictive Debugger
JetBrains Rider 2023.3 introduces the Predictive Debugger feature, which predicts code execution paths and potential variable values and exceptions.


